






OCTOBER 5, 2023|DATA & ANALYTICS
The Binge Blanket and More Of The Year's Best Data Visualizations
Every year the Data Visualization Society considers hundreds of entries to select its Information Is Beautiful Awards Shortlist winners. This year’s honorees include some fascinating entries such as an illustrated explanation of Russia’s deportation of Ukrainians, a digital double infopoem “reflecting on the insanely specific and biased inferences algorithms make about us,” and a graphic of plastic bag usage at UK supermarkets over a five year period.
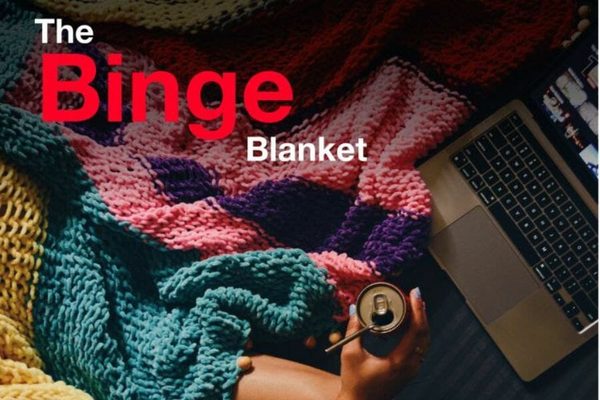
Several projects took personal screen time or streaming entertainment data and chose to visualize that in some unusual ways. The Binge Blanket, for example, is a hand-woven piece where “each thread of the yarn depicts an hour of the binge from a day in 2021 and the colour depicts the genre of the media viewed.” Altogether the projects showcase not only how graphics can help us spotlight data that matters most, but also how visualized information can help us better understand ourselves.
Rohit speaks on this topic. See his AI keynote.
Related Posts
Book Rohit To Speak
Want to bring these ideas to your next event?
Rohit turns the thinking behind posts like this one into keynotes for audiences around the world, from Fortune 500 leadership teams to global industry conferences.
Learn More About Speaking
How It All Started
A Short Backstory Of This Blog
This is a blog about non-obvious ideas. Originally launched on the Typepad platform in 2005 as the Influential Marketing blog, the stories at first focused mainly on digital marketing while Rohit worked at Ogilvy Advertising. In 2015 Rohit officially rebranded to the Non-Obvious Insights Blog and published his WSJ bestseller Non-Obvious. For the past twenty one years, this blog has coined new terms, introduced future marketing practices and inspired the next generation of non-obvious thinkers and marketers.